The problem with how most organizations talk about IT risk
Ask your IT team about risk and you will get a vulnerability scan with 847 findings color-coded red, yellow, and green. Ask your CISO — if you have one — and you will get a heat map and a maturity score. Neither of these tells you what you actually need to know: how much money is at stake, and what does it cost to reduce the exposure?
This is not a communication failure. It is a framework failure. Most IT risk assessments are built by security practitioners for security practitioners. They use language, scoring systems, and prioritization methods that make perfect sense inside a SOC but are meaningless in a board room or a budget meeting.
The IT Risk Quantification Model solves this by giving finance and operations leaders a structured method for converting technical risk into financial terms — the same language you use for every other category of business risk.
Who this is for
CFOs, controllers, COOs, and business owners at organizations with 50 to 500 employees who need to:
- Justify cybersecurity spend to a board or ownership group
- Compare the cost of a control against the cost of the risk it mitigates
- Make defensible decisions about which risks to accept, transfer, or remediate
- Prepare for cyber insurance renewals with quantified risk data
- Evaluate whether their IT provider’s recommendations are proportionate to actual exposure
No security background required. This model is built for finance professionals.
The four components of risk quantification
Every IT risk can be expressed as a financial equation. The model breaks this into four components that build on each other:
1. Asset valuation
Before you can price a risk, you need to know what you are protecting and what it is worth. Asset valuation is not about replacement cost — it is about business impact.
For each critical system or data set, you estimate:
- Revenue dependency — how much revenue flows through or depends on this system per hour, per day, per quarter
- Recovery cost — what it costs to restore the system to a functional state, including labor, vendor fees, and hardware
- Regulatory exposure — the fines, penalties, or legal costs triggered if this data is compromised or this system fails a compliance requirement
- Reputation cost — the customer churn, lost deals, or brand damage from a public incident involving this asset
Most organizations have 5 to 15 critical assets. You do not need to value everything — just the systems where a failure creates a material financial event.
2. Threat probability estimation
This is where most risk models fall apart for non-technical audiences. Security teams express probability in terms of CVE scores and attack surface analysis. Finance teams think in terms of annual likelihood percentages.
The model provides a structured way to estimate the probability that a specific threat materializes against a specific asset within a 12-month window. You consider:
- Industry benchmarks — the Verizon DBIR and IBM Cost of a Data Breach Report provide incident rates by company size and industry
- Current control posture — what protections are in place today and how effective they are
- Threat landscape trends — whether attacks against your industry or technology stack are increasing
- Historical incidents — any near-misses or actual incidents your organization has experienced
The output is not a precise number — it is a defensible range (e.g., 5-15% annual probability) that can be used in financial calculations.
3. Single loss expectancy (SLE)
SLE answers the question: if this specific threat materializes against this specific asset, what is the total financial impact?
It combines the asset valuation components:
SLE = Revenue loss + Recovery cost + Regulatory exposure + Reputation cost
For a ransomware attack against your primary line-of-business application, that might look like:
- Revenue loss during 5 days of downtime: $375,000
- Recovery and forensics costs: $120,000
- Regulatory notification and potential fines: $85,000
- Customer churn from the incident: $200,000
- SLE: $780,000
This is not a precise prediction. It is a structured estimate that gives leadership a number to work with — which is infinitely more useful than a heat map color.
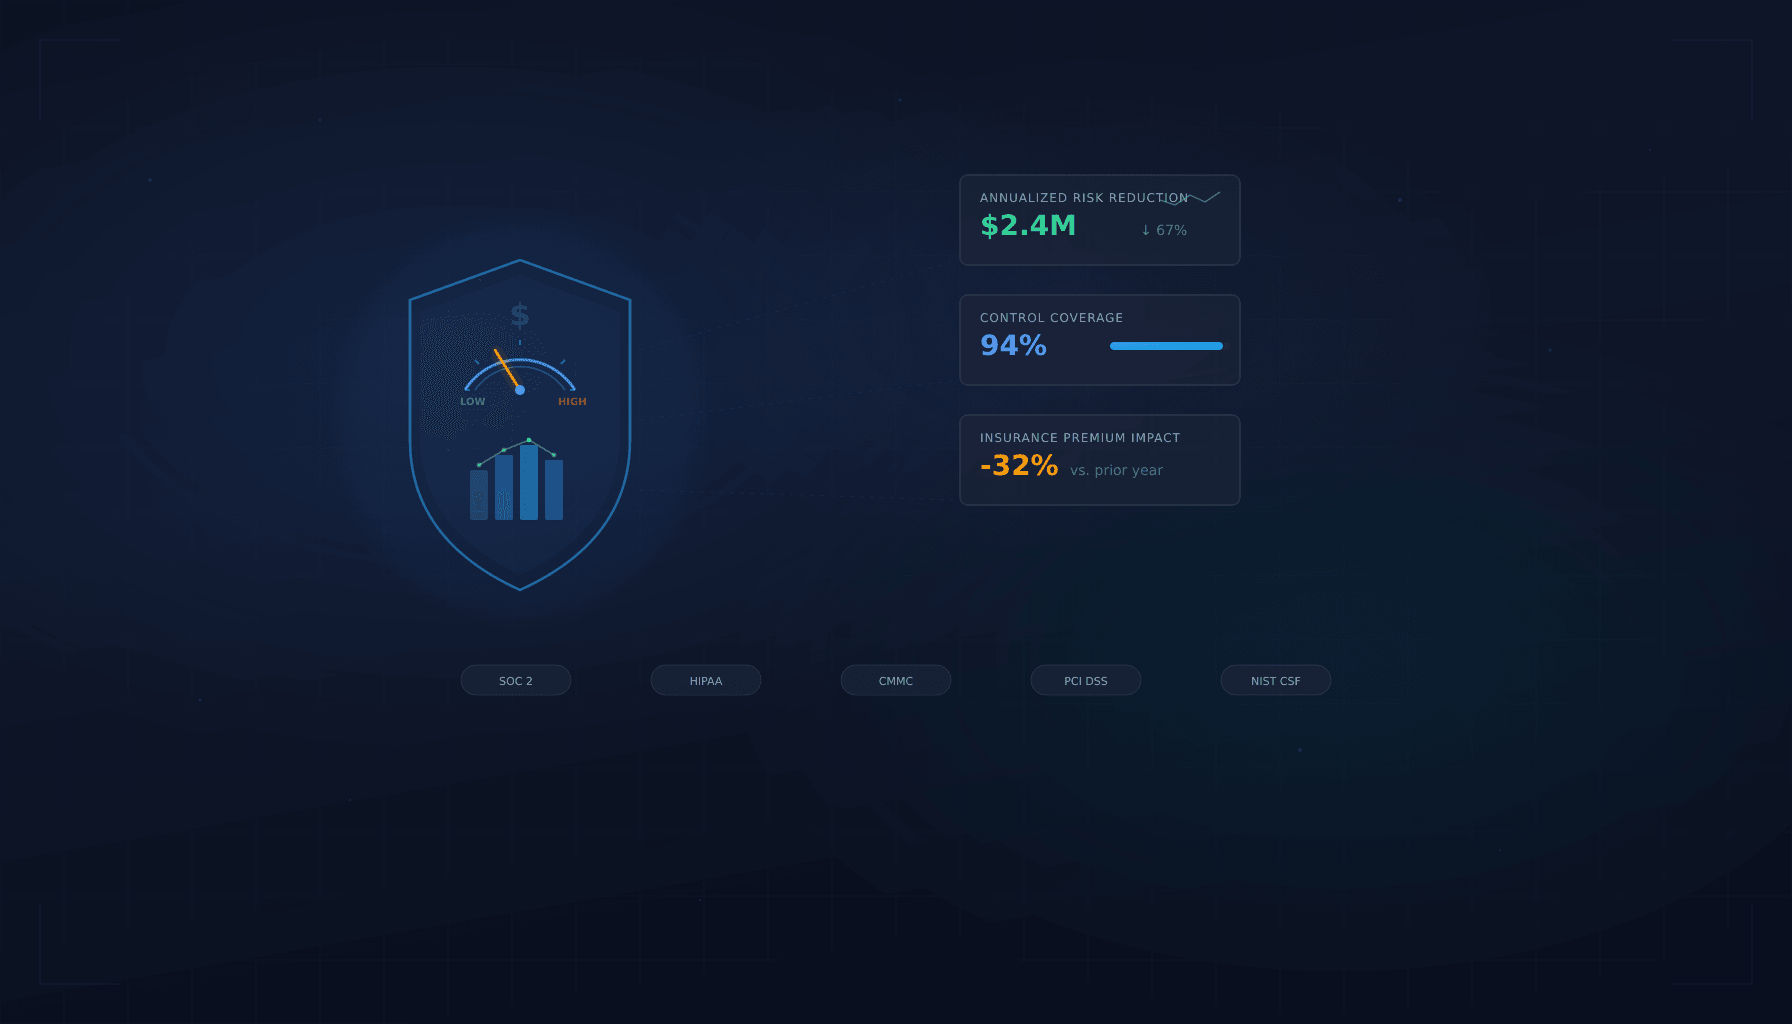
4. Annualized loss expectancy (ALE)
ALE is the number that drives budget decisions. It answers: what is the expected annual cost of this risk if we do nothing?
ALE = SLE × Annual probability
Using the ransomware example with a 10% annual probability:
ALE = $780,000 × 10% = $78,000/year
This is the number you compare against the cost of controls. If an endpoint detection and response (EDR) solution costs $35,000/year and reduces the probability of a successful ransomware attack by 60%, the risk reduction math is straightforward:
- ALE before control: $78,000
- ALE after control: $78,000 × 40% = $31,200
- Risk reduction: $46,800/year
- Control cost: $35,000/year
- Net benefit: $11,800/year
Now you have a business case, not a vulnerability report.
How to use this model in practice
During budget season
Run the model against your top 10 risks. Compare the ALE of each risk against the cost of the controls your IT team or MSP is recommending. This gives you a rank-ordered list of investments by return on risk reduction — the same logic you use for any other capital allocation decision.
During cyber insurance renewals
Underwriters are increasingly asking for quantified risk data. An organization that can present its risk register in ALE terms, with documented controls and residual risk calculations, negotiates from a position of strength. See the Cyber Insurance Readiness Checklist for the specific controls insurers verify.
During board or leadership meetings
The model translates directly into the Board and Leadership Risk Report Template — executive summaries with dollar figures, risk heat maps with financial anchors, and before/after comparisons that show the impact of security investments.
When evaluating your IT provider
If your MSP cannot explain the financial impact of their recommendations, they are selling services, not managing risk. The quantification model gives you a framework for holding providers accountable to business outcomes instead of technical activity metrics.
Common mistakes to avoid
- Trying to quantify every risk — focus on the top 10-15 risks that represent 80%+ of your exposure. The long tail is noise.
- Using precise numbers where ranges are honest — a probability of “12.7%” implies false precision. Use ranges (10-15%) and document your assumptions.
- Ignoring cascading effects — a compromised email system affects more than email. Map dependencies before estimating impact.
- Forgetting risk transfer — some risks are better transferred (insurance) than mitigated (controls). The model helps you decide which.
Related resources
This model is one component of the CFO Playbook for IT Risk Analysis. For adjacent tools that work alongside it:
- Current-State Risk Scorecard — assess your organization’s posture across eight domains before running the quantification model
- IT Spend Efficiency Worksheet — map every IT dollar to the risk it mitigates or the function it enables
- Cybersecurity Risk Assessment Template — a structured framework for identifying the threats and vulnerabilities that feed into this model
- IT Budget Planning Worksheet — connect your risk quantification outputs to actual budget line items
Need help quantifying your IT risk?
Our team can walk you through the model using your actual environment and financial data.
Get a Free AssessmentRelated Resources
Board and Leadership Risk Report Template
A presentation-ready template for communicating IT risk to non-technical stakeholders with executive summaries, risk heat maps, and budget justifications.
View resource →IT Spend Efficiency Worksheet
Map every IT and security dollar to the risk it mitigates, the compliance requirement it satisfies, or the business function it enables.
View resource →
The CFO's Playbook to IT Risk
Evaluate technology risk in financial terms. A framework for CFOs to quantify IT exposure, align security spend, and present risk posture to the board.
View resource →Ready to Get Started?
Contact us today for a complimentary assessment valued at up to $25,000.