The communication gap is more expensive than the risk gap
Most organizations have a reasonable understanding of their IT risks — at least at the technical level. The IT team knows where the weaknesses are. The MSP has flagged the gaps. Somebody, somewhere, has a vulnerability report that describes exactly what could go wrong.
The problem is that this information never reaches the people who authorize budget, set risk tolerance, and make strategic decisions. When it does reach them, it arrives as a technical report in a language they do not speak — CVSS scores, maturity levels, control frameworks, and heat maps with no dollar signs attached.
The result: IT asks for budget. Leadership asks “why?” IT says “because it’s a risk.” Leadership says “everything is a risk — how much risk, exactly?” And the conversation stalls.
This template closes that gap. It provides a presentation-ready format for communicating IT risk to boards, executive teams, and ownership groups in the language they already use — financial exposure, probability, cost of controls, and return on risk reduction.
Who this is for
- CFOs presenting IT risk posture to a board of directors or ownership group
- IT directors who need to justify security investments to non-technical leadership
- CISOs or vCISOs preparing quarterly risk updates for executive teams
- Business owners who need to explain why IT spend needs to increase and what the organization gets for the money
What the template includes
1. Executive summary (one page)
The single most important page of the report. Leadership reads this. Everything else is supporting detail.
The executive summary format:
- Current risk posture — one sentence. “The organization’s overall IT risk posture is [strong/moderate/concerning], with critical gaps in [domains].”
- Top three risks — the three highest-exposure risks expressed in annualized dollar terms, not technical severity
- Recommended actions — the three highest-priority investments with cost and expected risk reduction
- Total ask — the budget required, the risk reduced, and the net financial benefit
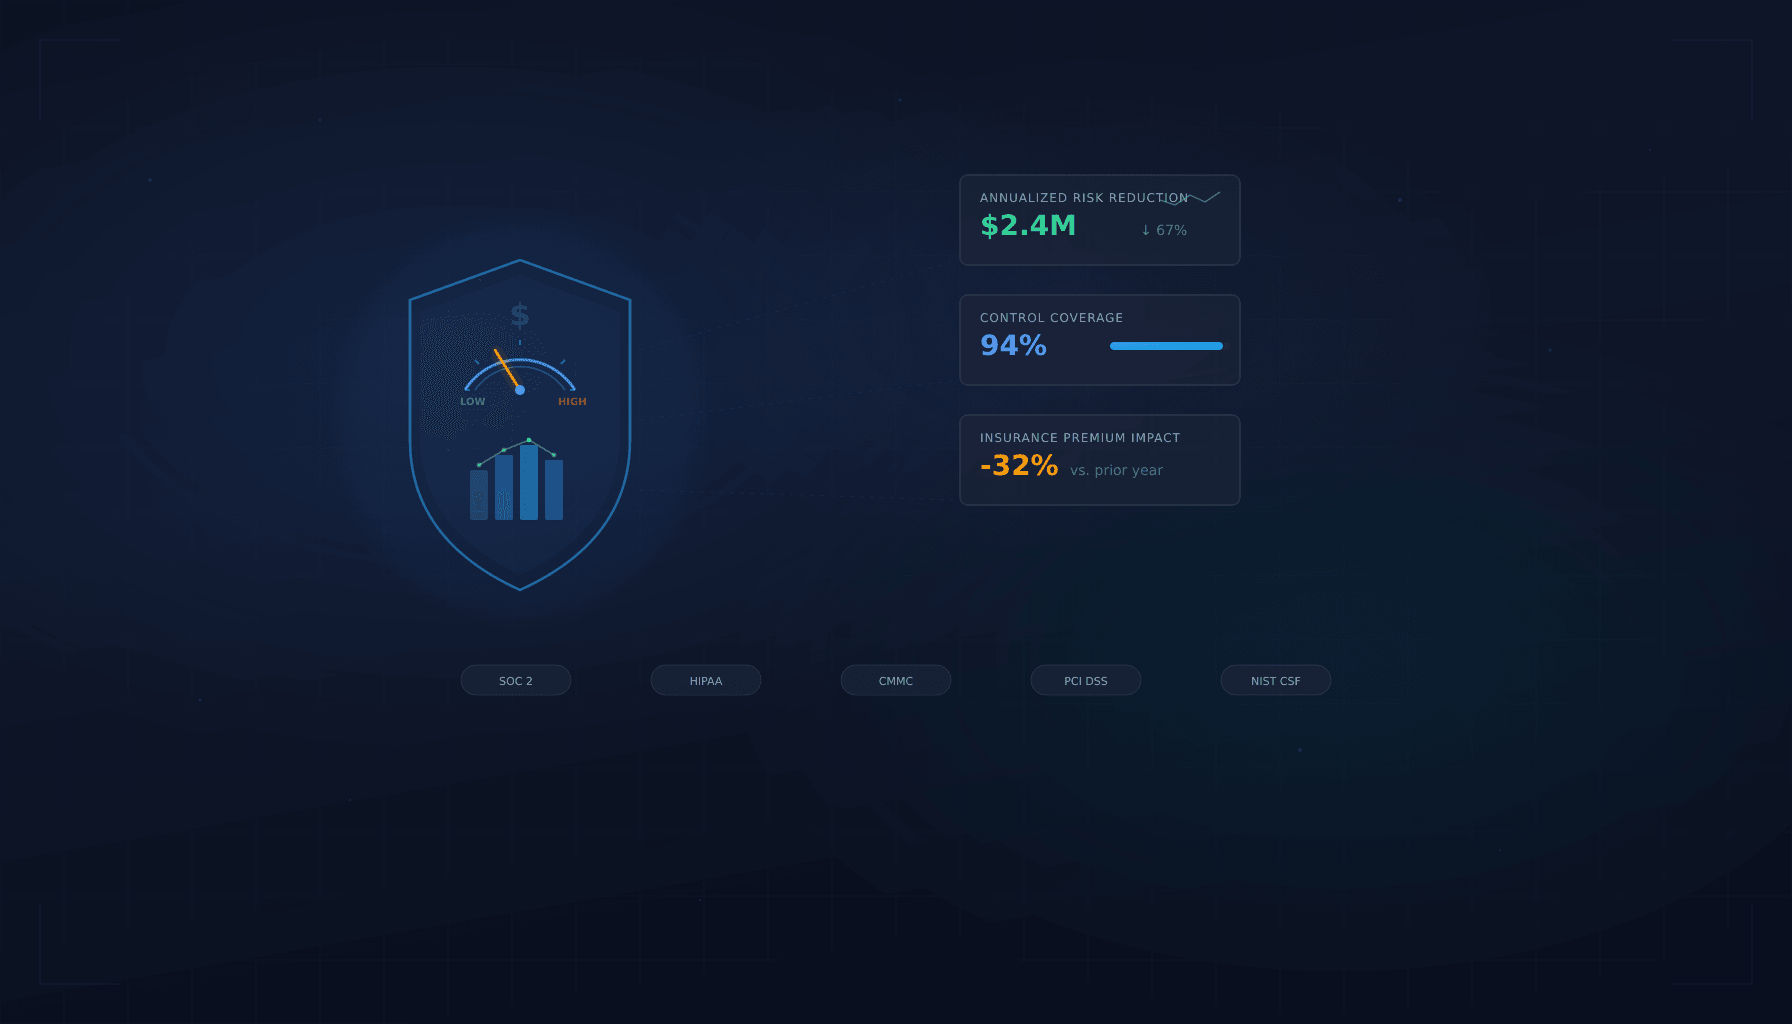
This is where the IT Risk Quantification Model pays off. An executive summary that says “we have critical vulnerabilities” gets filed. An executive summary that says “our annualized ransomware exposure is $312,000, and a $48,000 investment reduces it by 65%” gets funded.
2. Risk heat map with financial anchors
Traditional heat maps plot risks on a likelihood vs. impact grid colored red, yellow, and green. They look professional and communicate almost nothing — because “high impact” means different things to different people.
The template uses a financially anchored heat map where:
- The Y-axis (impact) is denominated in dollars — not “high/medium/low” but “$50K-$100K / $100K-$500K / $500K+”
- The X-axis (likelihood) is an annual probability range — “5-10% / 10-25% / 25%+”
- Each risk plots as a labeled point with its annualized loss expectancy visible
This format lets a board member look at the heat map and immediately understand: “We have three risks in the top-right quadrant with a combined ALE of $420,000, and the recommended controls cost $95,000.” That is a decision-ready presentation.
3. Domain scorecard summary
A one-page summary of the Current-State Risk Scorecard showing maturity scores across all eight domains:
- Endpoint security
- Access management
- Backup and recovery
- Network security
- Email security
- Vendor risk
- Compliance posture
- Incident response
Each domain shows the current maturity score (1-5), the target score, and the financial exposure associated with the gap. This provides leadership with a clear picture of where the organization is strong and where investment is needed — without requiring them to understand the technical details of each domain.
4. Budget justification section
This is where the IT Spend Efficiency Worksheet feeds in. The budget justification section presents:
- Current IT spend breakdown — categorized by risk mitigation, compliance coverage, and business enablement
- Proposed changes — new investments, consolidations, and reallocations with projected risk reduction for each
- Cost-benefit analysis — for each proposed investment, the cost of the control vs. the annualized risk reduction it delivers
- Net position — what the total budget change is and what the organization gets for it
The goal is to present IT investment decisions with the same rigor applied to any other capital allocation — expected return, payback period, and risk-adjusted benefit.
5. Before/after posture comparison
A side-by-side visualization showing:
- Current posture — domain scores, top risks, total annualized exposure
- Projected posture (if recommended investments are approved) — improved domain scores, reduced risk exposure, remaining residual risk
This is the most powerful section for boards that have been funding IT investments incrementally. It shows them: “Here is what we spent. Here is what it bought. Here is what is left.”
6. Trend tracking (for recurring reports)
If you present risk reports quarterly or annually, the template includes a trend section showing:
- How domain scores have changed since the last report
- Which risks have been reduced and which are new
- Whether the overall risk posture is improving, stable, or deteriorating
- How IT spend efficiency has changed over time
Trend data turns a one-time budget request into an ongoing governance conversation, which is what boards actually want.
How to present this to a board
Structure the meeting for a decision, not an education
Boards do not need a cybersecurity tutorial. They need enough context to make an informed decision about risk and budget. The recommended meeting structure:
- Executive summary (2 minutes) — the one-page overview. Start with the punchline: what the risk is, what it costs, and what you recommend.
- Heat map walkthrough (3 minutes) — point to the top-right quadrant. Explain the three highest-exposure risks in plain financial terms.
- Budget justification (5 minutes) — present the recommended investments with cost-benefit analysis. Show the before/after posture comparison.
- Discussion (10 minutes) — answer questions. Be prepared for: “What happens if we do nothing?” and “Can we do this in phases?”
Total: 20 minutes. If you need more than 20 minutes to present IT risk to a board, the report has too much detail in it.
Anticipate the questions
Boards and executive teams consistently ask:
- “How do we compare to peers?” — use industry benchmarks from the Verizon DBIR and IBM Cost of a Data Breach to contextualize your posture
- “What is the minimum we can spend?” — have a phased approach ready that addresses the highest-exposure risks first
- “Are we compliant?” — be prepared to separate compliance from security and explain why you may need to invest in both
- “What does our insurance cover?” — the Cyber Insurance Readiness Checklist provides the detail behind this answer
Do not present without numbers
A risk report without financial figures is an opinion. The IT Risk Quantification Model, the scorecard, and the spend efficiency worksheet all exist to give you the numbers. If you skip them, leadership will ask “how bad is it?” and you will have no answer better than “pretty bad.” That is not a budget presentation — it is a warning.
Common mistakes
- Including too much technical detail — the board does not need to know which CVEs are unpatched. They need to know the financial exposure of unpatched systems and the cost to close the gap.
- Presenting risk without a recommendation — identifying risk without proposing a response puts the decision back on people who lack the context to make it. Always present risk with a recommended action and a cost.
- Treating the report as a one-time event — risk posture changes. Present quarterly at minimum so leadership sees the trend, not a snapshot.
- Burying the ask — if you need budget, say so on page one. Do not make leadership discover the request on slide 14.
Related resources
This template is one component of the CFO Playbook for IT Risk Analysis. It depends on data from:
- IT Risk Quantification Model — provides the dollar figures for the executive summary and heat map
- Current-State Risk Scorecard — provides the domain maturity scores for the scorecard summary
- IT Spend Efficiency Worksheet — provides the budget breakdown and efficiency analysis
- Cyber Insurance Readiness Checklist — informs the insurance coverage discussion that boards inevitably raise
Need help preparing for your next board meeting?
Our team can build a customized risk report using your actual environment data and financial exposure.
Talk to Our TeamRelated Resources
IT Risk Quantification Model
A step-by-step framework for translating technical IT risks into financial terms that CFOs, boards, and insurers understand.
View resource →IT Spend Efficiency Worksheet
Map every IT and security dollar to the risk it mitigates, the compliance requirement it satisfies, or the business function it enables.
View resource →
The CFO's Playbook to IT Risk
Evaluate technology risk in financial terms. A framework for CFOs to quantify IT exposure, align security spend, and present risk posture to the board.
View resource →Ready to Get Started?
Contact us today for a complimentary assessment valued at up to $25,000.