Most organizations are spending money on IT without knowing what they are buying
The average SMB with 50 to 250 employees spends between $3,000 and $8,000 per employee per year on technology — hardware, software, cloud services, security tools, vendor contracts, and internal or outsourced support. That is a $150,000 to $2,000,000 annual line item that, in most organizations, has no clear mapping between what is spent and what it accomplishes.
IT spend shows up as vendor invoices, subscription charges, and headcount costs. It does not show up as “we spent $47,000 on controls that reduce our ransomware exposure by 60%” or “we are paying $18,000 for a tool that duplicates a capability we already have in Microsoft 365.”
The IT Spend Efficiency Worksheet changes that. It provides a structured method for decomposing every IT and security expenditure into one of three categories: risk mitigation, compliance coverage, or business enablement. Anything that does not fit into one of those categories is either redundant, misaligned, or unnecessary.
Who this is for
- CFOs who approve IT budgets but cannot explain what the money is buying
- IT directors who need to justify their budget to finance leadership
- Business owners who feel like IT costs keep climbing without proportionate improvement
- Organizations evaluating their MSP who want to understand whether their provider’s recommendations align with actual business needs
The three categories
Every IT expenditure should tie to at least one of these. If it does not, it warrants scrutiny.
Risk mitigation
Money spent to reduce the probability or impact of a security incident. Examples:
- EDR/MDR licensing — reduces endpoint compromise risk
- Security awareness training — reduces phishing success rates
- Backup and disaster recovery — reduces ransomware impact
- Multi-factor authentication — reduces credential theft risk
- Network segmentation — limits lateral movement after a breach
For each risk mitigation expense, the worksheet captures: what risk it addresses, what the risk costs without the control (from your IT Risk Quantification Model), and what residual risk remains with the control in place.
This is where most SMBs find their biggest efficiency gains. Common patterns:
- Overlapping tools — paying for both a standalone email security gateway and the advanced threat protection already included in Microsoft 365 E5
- Underutilized licenses — paying for an EDR solution that is deployed on 60% of endpoints because the rollout was never completed
- Legacy controls — maintaining an on-premises firewall appliance with an expired threat intelligence subscription alongside a cloud-delivered security stack that already provides the same coverage
Compliance coverage
Money spent to meet regulatory or contractual requirements. Examples:
- HIPAA compliance tooling and documentation
- SOC 2 audit preparation and annual assessment
- CMMC certification readiness for defense contractors
- PCI DSS scanning and validation for payment processing
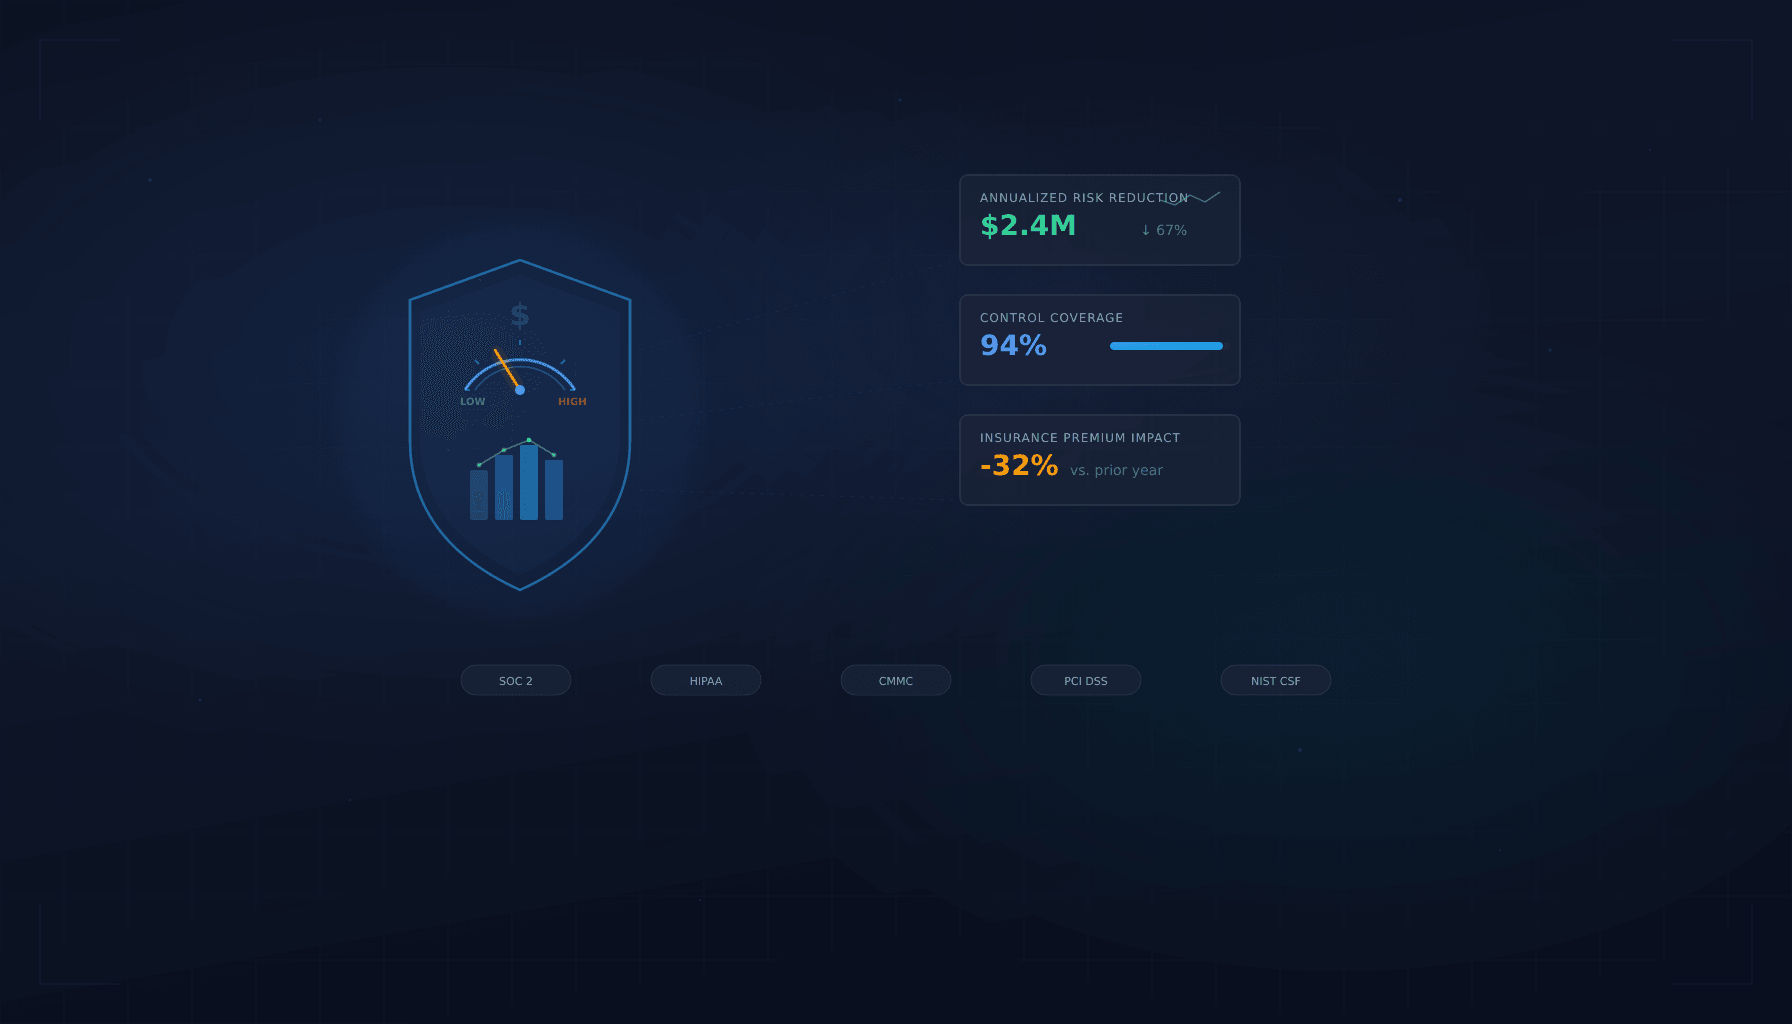
- Cyber insurance premiums
For each compliance expense, the worksheet captures: which framework it satisfies, whether it also provides risk mitigation (dual-purpose spend), and whether the compliance requirement is mandatory or contractual.
The most common inefficiency here is paying for compliance separately from security. Many security controls — endpoint protection, access management, logging and monitoring — satisfy compliance requirements as a byproduct. Organizations that buy compliance-specific tools on top of existing security controls often pay twice for the same coverage.
The Compliance Readiness Scorecard can help you identify which controls already satisfy which frameworks, so you can eliminate redundant compliance-only spend.
Business enablement
Money spent to support operations, productivity, and growth. Examples:
- Microsoft 365 or Google Workspace licensing
- Line-of-business application hosting and support
- Help desk and end-user support
- Network infrastructure and internet connectivity
- Hardware lifecycle management
For each business enablement expense, the worksheet captures: which business function it supports, what the impact would be if it were unavailable, and whether the current spend level is proportionate to the business value.
The inefficiency pattern here is usually over-provisioning or under-negotiating. Organizations paying for Microsoft 365 E5 licenses when E3 covers their needs, or renewing a three-year hardware warranty on equipment they plan to replace in 18 months.
How to use the worksheet
Step 1: Inventory every IT expenditure
Pull every IT-related line item from the past 12 months. Include:
- Software subscriptions (SaaS, on-premises licenses, cloud services)
- Hardware purchases and leases
- Vendor and contractor payments (MSP, consultants, project work)
- Internal IT staff fully loaded costs
- Telecom and connectivity
- Insurance premiums (cyber insurance specifically)
- Training and certification costs
Most organizations miss 15-25% of their IT spend on the first pass because costs are distributed across departments. Marketing has its own SaaS stack. Sales has CRM costs. HR has benefits administration software. Operations has equipment monitoring tools. All of it counts.
Step 2: Categorize each expenditure
Assign each line item to one or more of the three categories. Some expenditures serve multiple purposes — an EDR solution is both risk mitigation and a compliance control. Document the dual-purpose items explicitly because they represent your highest-efficiency spend.
Step 3: Identify the three patterns
Look for:
Redundant spend — multiple tools or services covering the same risk, compliance requirement, or business function. This is the easiest money to recover because you can eliminate the duplicate without increasing risk.
Unprotected risk — risks identified in your Current-State Risk Scorecard that have no corresponding spend in the risk mitigation category. This is where you need to add budget — and the IT Risk Quantification Model tells you exactly how much the exposure costs.
Misaligned allocation — spend that is disproportionate to the risk it mitigates or the value it enables. The classic example: spending $60,000/year on a premium firewall with every add-on module, while spending $0 on security awareness training despite phishing being the number one attack vector.
Step 4: Build reallocation recommendations
The goal is not necessarily to reduce total IT spend — it is to ensure every dollar is working. Common outcomes:
- Consolidate overlapping tools to recover $15,000-$40,000 that funds higher-priority controls
- Redirect over-provisioned licensing to close the MFA gap or deploy endpoint protection to uncovered devices
- Identify compliance controls that also reduce risk, avoiding the need for separate security investments
- Build a 12-month roadmap that improves posture without increasing the total budget
What CFOs typically find
After running this worksheet with organizations in the 50-250 employee range, these are the most common findings:
- 20-30% of security tool spend is redundant — overlapping capabilities between the Microsoft 365 security stack and standalone security products that were added before the Microsoft capabilities existed
- Backup and recovery is underinvested relative to its risk impact — organizations spending $100,000+/year on perimeter security with $5,000/year on backups that have never been tested
- Compliance costs can be reduced 30-40% by mapping compliance requirements to existing security controls instead of purchasing framework-specific tooling
- Hardware lifecycle costs are inflated by maintaining equipment past its efficient lifespan because no one tracked the replacement schedule
Related resources
This worksheet is one component of the CFO Playbook for IT Risk Analysis. Tools that feed into and build on this analysis:
- IT Risk Quantification Model — provides the financial exposure numbers that make the efficiency analysis meaningful
- Current-State Risk Scorecard — identifies the domains where spend may be misaligned with actual risk
- IT Budget Planning Worksheet — translate your efficiency findings into next year’s budget
- Board and Leadership Risk Report Template — present your spend efficiency analysis alongside risk posture improvements
Want help auditing your IT spend?
Our team can map your current IT expenditures to risk, compliance, and business value in a complimentary assessment.
Request an AssessmentRelated Resources
Board and Leadership Risk Report Template
A presentation-ready template for communicating IT risk to non-technical stakeholders with executive summaries, risk heat maps, and budget justifications.
View resource →IT Risk Quantification Model
A step-by-step framework for translating technical IT risks into financial terms that CFOs, boards, and insurers understand.
View resource →
The CFO's Playbook to IT Risk
Evaluate technology risk in financial terms. A framework for CFOs to quantify IT exposure, align security spend, and present risk posture to the board.
View resource →Ready to Get Started?
Contact us today for a complimentary assessment valued at up to $25,000.